
In the first part of this article, the basic elements of the Patent Matrix–and the benefits it can provide–were introduced.
Now, it’s time to dig in and take a closer look at some examples of how the Patent Matrix has been used in a variety of real-world cases* (exact details have been obscured) to perform patent landscape analysis.
Effective in Every Aspect of Patent Search
Basically speaking, the Patent Matrix can be an effective tool in just about every type of patent search activity, including (but not limited to)
- Freedom to Operate (Patent Clearance)
- State of the Art (Patent Landscaping)
- Patentability
- Patent Due Diligence
- Patent Portfolio Management
And because the Patent Matrix presents information in clear, easy-to-read tables, it is easy for both IP professionals and business leaders alike to grasp the patent landscape analysis insights it provides.
Patent Landscape Analysis Case 1–Patent Portfolio Comparison (Quality and Value)
Let’s take a look at how the Patent Matrix can conduct patent landscape analysis by comparing and contrasting the patent portfolios of two companies–Company A and B.
In this case, the Patent Matrix was used to visualize, in specific, the US patent quality and value distribution of each company.
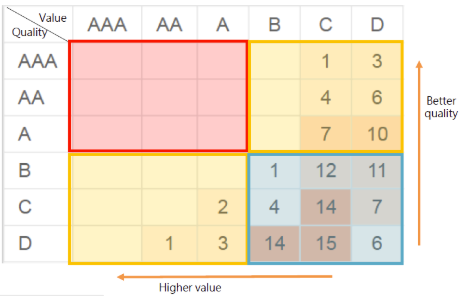
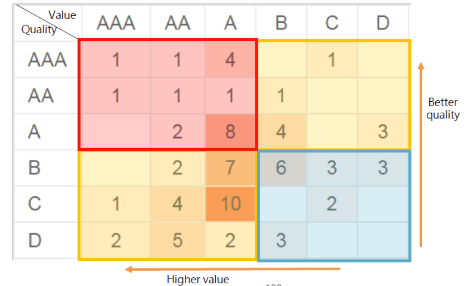
As we can see, even though Company A has more overall US patents than Company B, the Patent Matrix clearly shows that many, if not most, of these patents are actually low quality and low value.
At the same time, even though Company B has a smaller overall patent portfolio, it’s clear from the Patent Matrix that Company B has more high-quality and high-value patents than Company A.
With this patent landscape analysis, it is easy to gain a better insight into which of these companies might be the best candidate to receive investment.
Patent Landscape Analysis Case 2–Overview of Company’s Technology and Patent Activity
The Patent Matrix can be used to gain a better understanding of the patent activity and technology structure of a company, whether it be your own company, a client, or a competitor.
In this case, the patent landscape analysis was used to show Company C’s different technology and the filing years of patents in these areas.
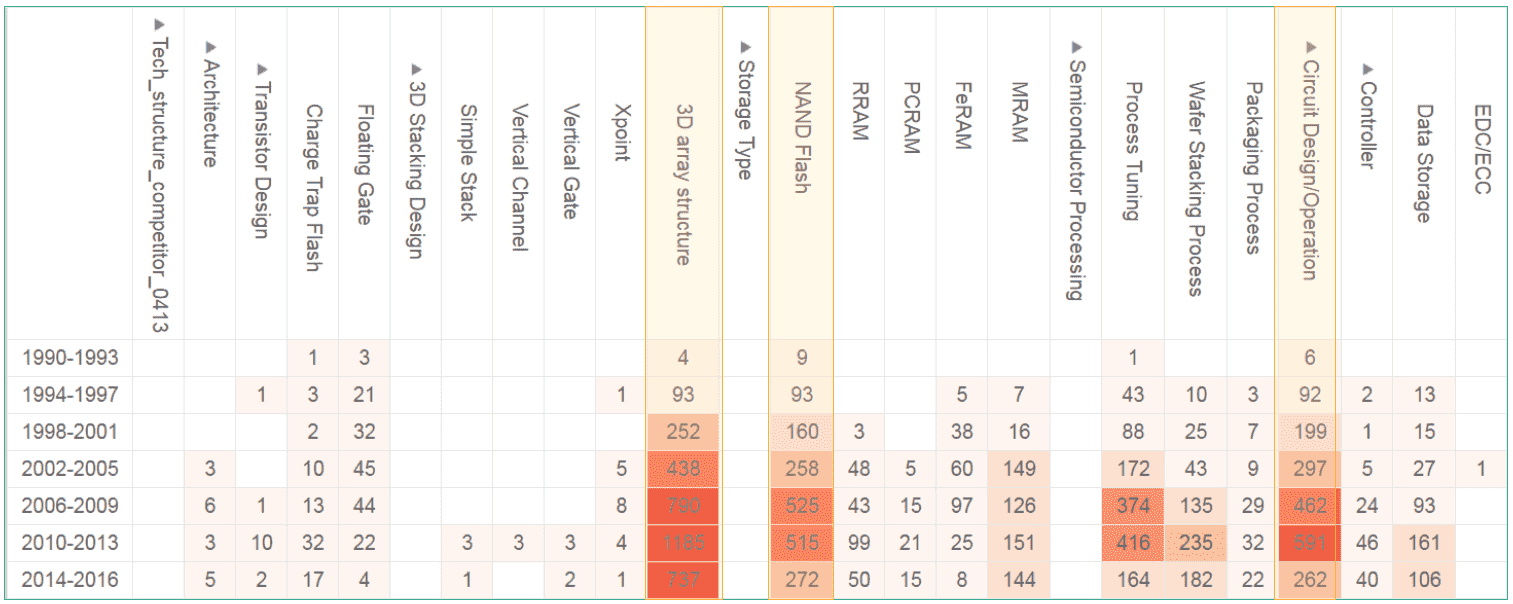
Taking a closer look, we can see Company C began to develop its 3D array structure in 1990, and it continued to increase its patent activity in this area from 1990 to 2013.
This may suggest that Company C chose to focus on this area of technology during this period, while investing less heavily in other areas over the same time frame.
Patent Landscape Analysis Case 3–Overview of a Market
The Patent Matrix also can be used to gain a better understanding of a specific market–in this case, NAND Flash.
By plugging in the market’s major players in one axis and the technology structure of each company in the other axis, patent landscape analysis is easily created to analyze the patent activity related to this market.
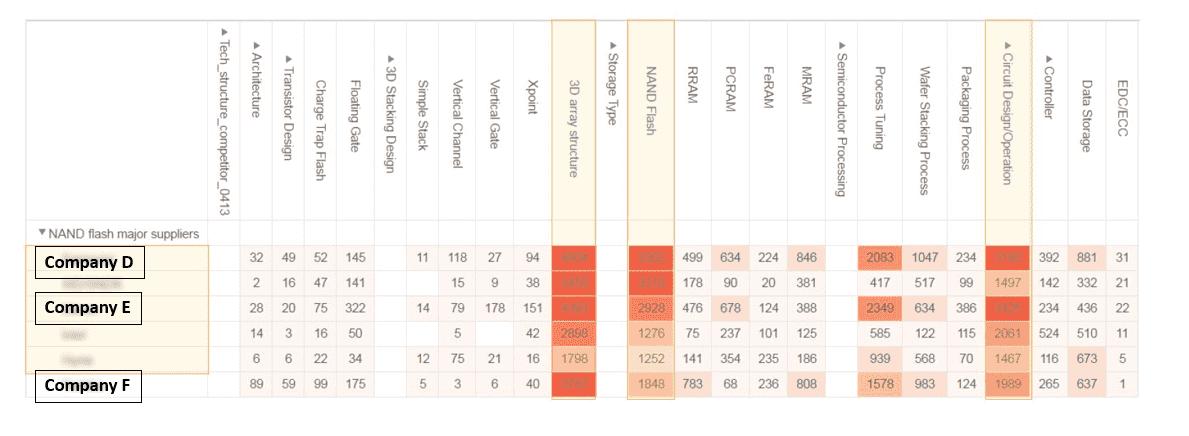
From the Patent Matrix, it is clear that Company D is focusing on MRAM and PCRAM, which are alternative technologies to NAND flash. At the same time, other companies in this market have also been working on different NAND alternatives, with Company E concentrating on PCRAM and Company F devoting its efforts to MRAM and RRAM.
A Powerful Tool for Patent Landscape Analysis and Insights
The above are just a few examples of how the Patent Matrix has already been utilized effectively to conduct patent landscape analysis in real-world cases.
Again, the Patent Matrix is the only patent search tool available today with completely customizable hierarchical data on both the X-axis and Y-axis, combined in one pivot table.
For patent professionals, the Patent Matrix can be used not only to optimize workflows, but also to perform data analysis that delivers real insights, all in clearly visualized tables.
Clearly, the Patent Matrix puts the power of data analysis in the palm of your hand.
To learn more about the Patent Matrix, click here.
To explore Patent Matrix sign up now!

Download our white paper Patent Lifecycle Management: What, Why, and How? to discover how the Patent Quality and Value Rankings work in detail.