
Each year, the Japan Patent Office (JPO) issues an annual report, which includes data such as the number of patent applications, the top filing companies, and the types of patent applications.
In this article—to save you time—we have sourced and summarized the top ten takeaways to give you an overview of Japan’s latest patent trends.
If you feel like a trip down memory lane, why not take a look at our key takeaways from last year’s JPO annual report.
307,969 patent applications were filed in 2019
International patent applications are still on the rise.
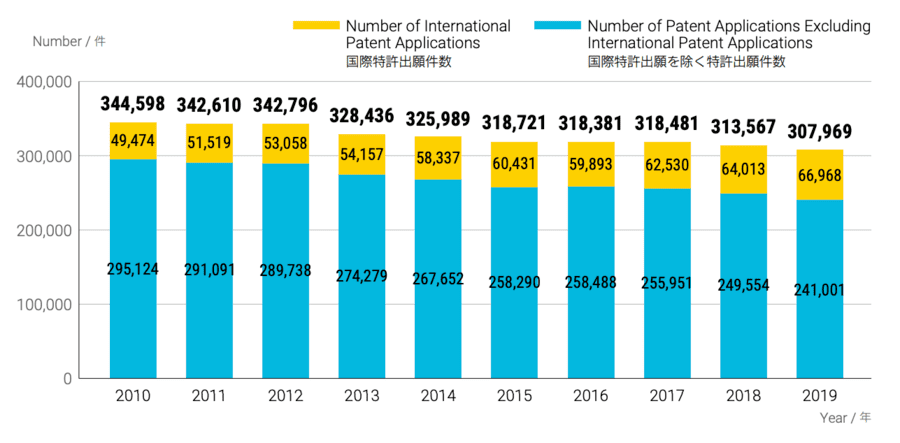
The overall number of patent applications decreased slightly in 2019 (-1.78%) compared to 2018 (when 313,567 applications were filed). However, the number of international patent applications grew from 64,013 to 66,968 (+4.61%).
Again, this patent application data appears to confirm the trend that has been continuing over the years (overall patent applications declining while international patent applications increase at a similar pace).
179,910 patents were granted
The number of granted patents has decreased year-on-year since 2016.
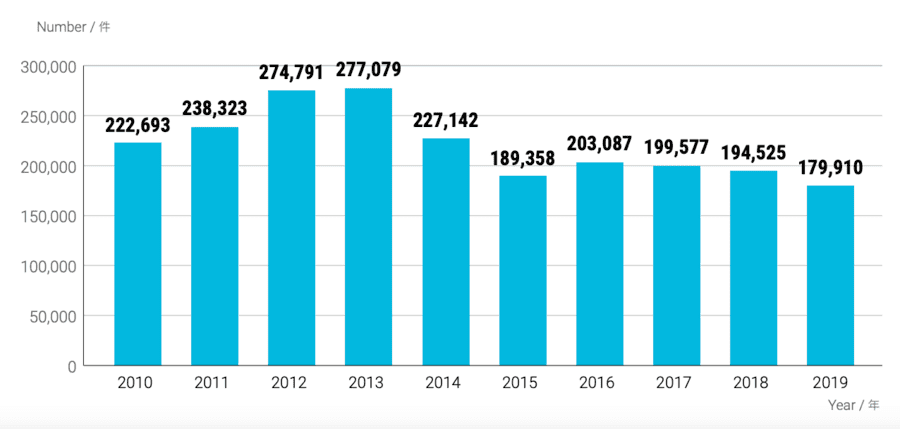
Of the 307,969 patent applications in 2019, 179,910 patents were successfully granted (58.31%). In 2018, 62% of the patent applications were granted. The number of granted patents has been declining steadily since 2016, with 2019’s application-to-grant ratio being the second-lowest since 2009 (55%).
US applicants are the next in line after Japan as the major filers of patent applications of 2019
China, Germany, and South Korea follow the US and Japan to make up the top 5.
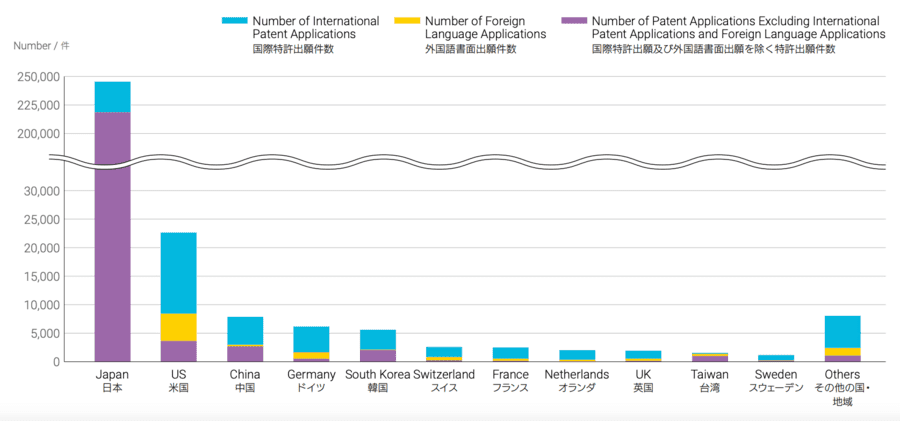
Japanese entities filed 245,372 applications in 2019. The US made second place with 22,867 patent applications. The bulk of Japan’s total number of applications came from their domestic filings (218,868).
Completing the top 5 for domestic applications are the US (3,733), China (2,686), South Korea (2,044), and Taiwan (1,030). Interestingly, the same four countries made up the top 5 with Japan in the lead back in 2018, the only difference in 2019 being China overtaking South Korea in the list.
As in 2018, Japan remained in pole position for the number of international patent applications too (26,234), followed by the US (14,324), and China (4,891).
The US once again took the top spot for applications in a foreign language with 4,810 applications; in 2018, the US filed 4,938 applications in a foreign language.
Canon, Mitsubishi, and Toyota had the greatest number of domestic patents granted in 2019
Mitsubishi drops from the top spot.
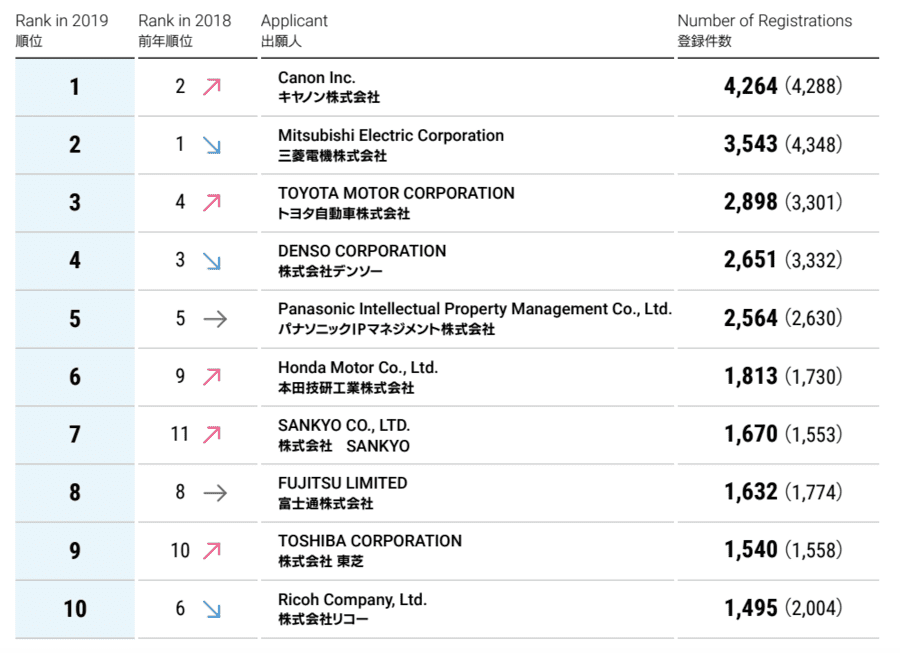
Canon Inc. climbed from position two to take the top spot in 2019’s list of the top filers of domestic patent applications. Toyota also moved up the ladder from position four to position three.
Ricoh Company, Ltd. suffered a steep drop in 2019, moving from position six to position ten.
Overall, most of the top ten filers filed fewer applications in 2019 when compared to 2018’s numbers. The only companies with higher filing numbers in 2019 are Honda Motor Co., Ltd., and SANKYO CO., LTD.
Google LLC enters the top 10 foreign companies with the most patent registrations
QUALCOMM Incorporated, HUAWEI TECHNOLOGIES CO., LTD., and Royal Philips remain in the top 3.
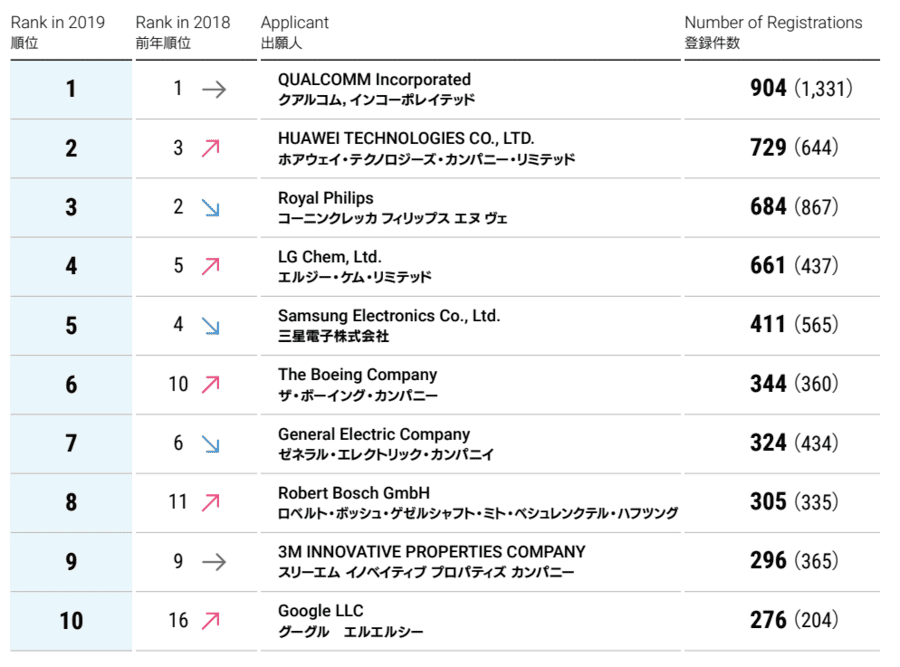
Qualcomm remained in position one; Royal Phillips dropped from position two to position three, and Huawei climbed from position three to position two.
The top three companies filed a total of 2317 patent applications in 2019, making up 46.68% of the whole top 10 combined.
Google LLC entered the top 10 with a massive leap from position sixteen to position ten.
The number of PCT applications continues to increase
The figures show a steady continuous increase since 2014.
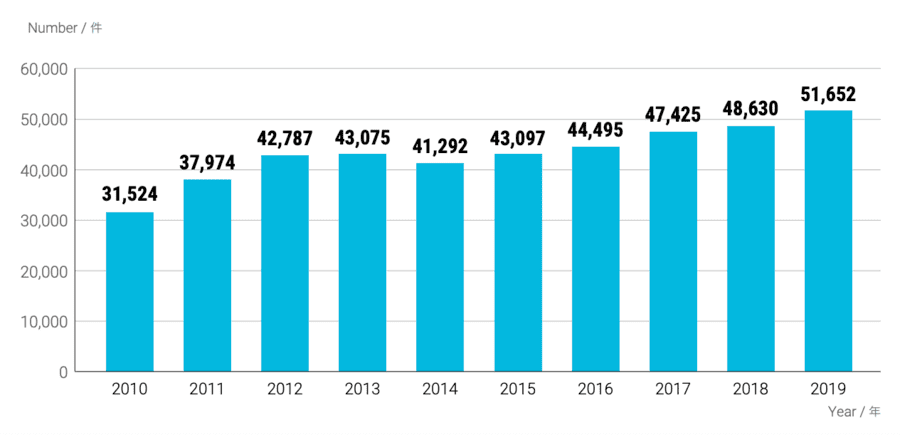
Other than the dip in 2014 (where there was a decrease of 4.1%), PCT international applications filed with the JPO as the receiving office have been increasing consistently year-on-year, climbing from 31,524 in 2010 to 51,652 in 2019 (an increase of 63.84%).
The number of domestic utility model applications continues to decline
Domestic utility model applications in 2019 have decreased by 39.61% when compared to 2010.
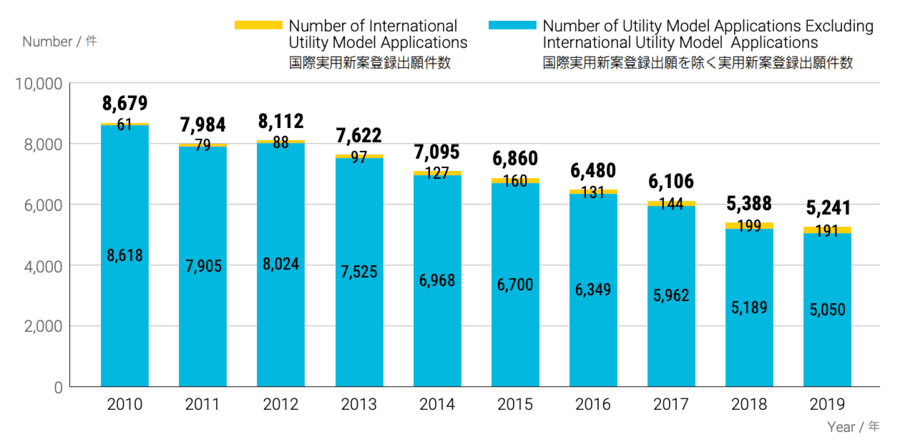
While the domestic utility model applications have shown an overall downtrend since 2010, the number of international utility model applications has increased from 61 applications in 2010 to 191 in 2019.
The number of design patent applications remains steady
There has been very little fluctuation in the number of design patent applications since 2010.
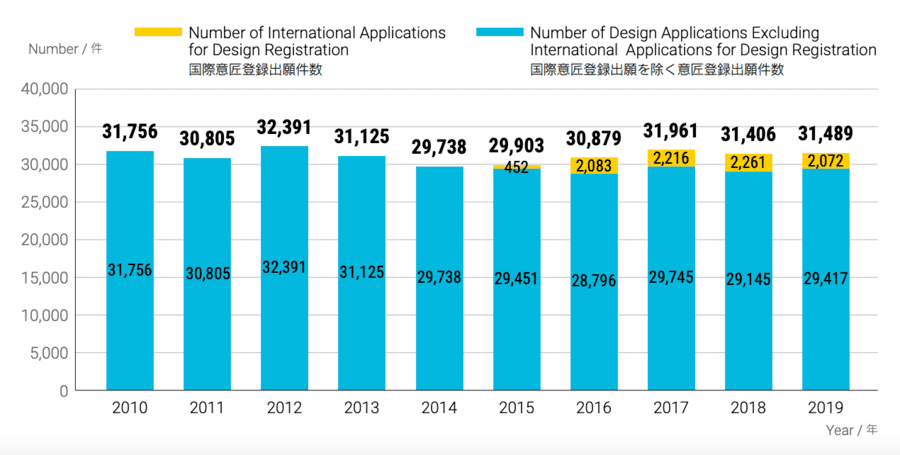
Reaching a peak of 32,391 applications in 2012, the total number of design patent applications has remained steady since 2010. International design patent applications surged from 452 in 2015 to 2,083 in 2016 and have not fluctuated much since then. The JPO began to process international applications filed under the Geneva Act on May 13, 2015.
The number of granted design patents remains consistent too
The majority of design patent applications are successfully granted.
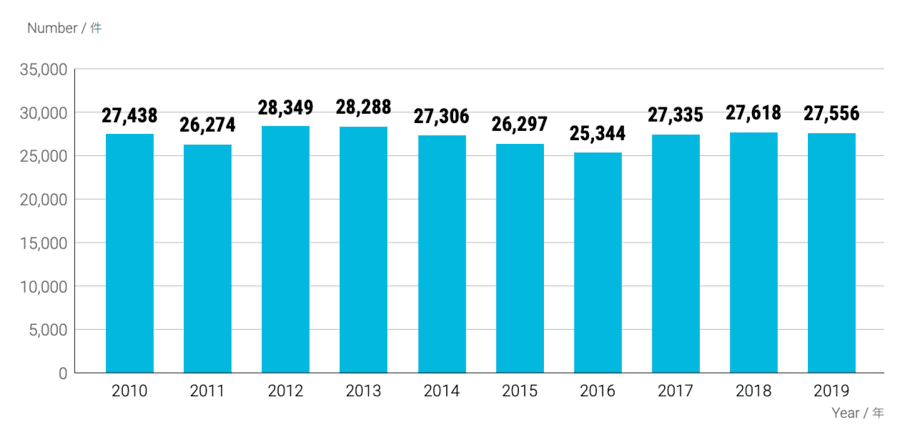
By comparing the figures for the number of design patent applications with the number of granted design patent applications, it’s apparent that most design patent applications are granted. In 2019, 27,556 out of 31,489 design patent applications were granted successfully (87.1%).
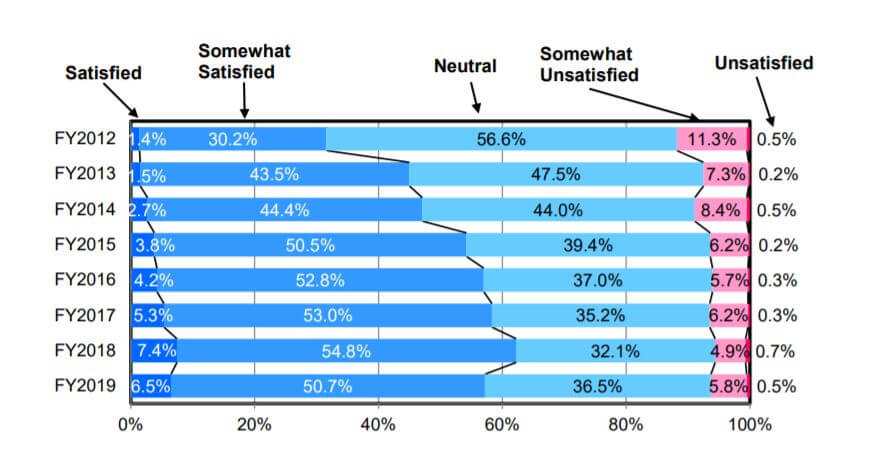
Satisfaction guaranteed?
The satisfaction levels are down when compared to last year’s figures.
The JPO has implemented various techniques to increase user satisfaction over the years, including interviews with patent examiners and video conferencing facilities for foreign applicants or applicants in isolated areas.
Emphasis is also put on the JPO’s efforts to speed up the examination process via fast-track examinations, prior art search outsourcing, and obtaining the necessary amount of examiners.
The trend for positive feedback has increased year-on-year until 2018. 2019’s figures show that there are less “satisfied” and “somewhat satisfied” applicants and more “neutral”, “unsatisfied”, and “somewhat unsatisfied” applicants.
Share your thoughts and predictions with us
We hope that you have enjoyed our key takeaways from the JPO 2020 report. We are certainly looking forward to seeing what the JPO 2021 report has in store for us. If you have any predictions, why not share them in the comments, we would love to hear from you.